Depth of the Moho Discontinuity from Parker-Oldenburg Inversion and Geopotential Models
The Parker-Oldenburg inversion algorithm is defined as follows:
$$h(x)=F^{-1}(\frac{-F[\Delta g(x)]e^{-kz_0}}{2\pi G \rho}-\displaystyle\sum_{n=2}^{\infty} \frac{k^{n-1}}{n!}F[h^{n}(x)])$$
$$HCF(k)=\frac{1}{2}[1+\cos(\frac{k-2\pi \times WH}{2 \times (SH-WH)})] \ \ for \ \ WH \lt k \lt SH$$
$$HCF(k)=0 \ \ for \ \ k \gt SH$$
$$HCF(k)=1 \ \ for \ \ k \lt WH$$
$$\Delta g_ {CB} = \Delta g_ {FA} - C_ {sb} +T.C.$$
Where ∆gCB is the complete Bouguer gravity anomaly; ∆gFA is the Free-Air gravity anomaly that is calculated from the spherical harmonics of the EGM2008 geopotential model up to degree and order of 2190; Csb is the simple Bouguer reduction that is defined as Csb=2.π.ρ.G.Ho (ρ: 2670kg/m3; G: gravitational constant; Ho: orthometric elevation acquired from ETOPO1 model); and T.C. is the terrain effects.
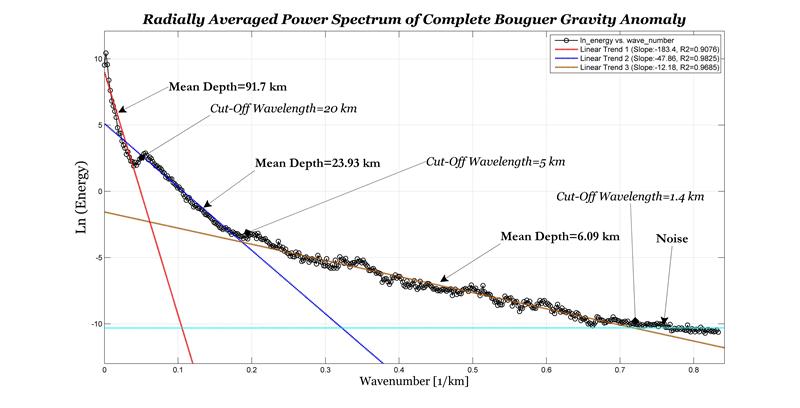
The computed Bouguer anomaly is a combination of long- and short-wavelength features. Generally speaking, a deeper source produces gravity anomalies with longer wavelength than a shallower source with the same size and density. In this study, in order to distinguish between deeper and shallower sources and do away with Bouguer anomalies with short wavelengths associated with shallow crustal sources, the radially averaged power spectrum of the complete Bouguer data has been calculated by Fourier analysis. Considering the log of power of the Bouguer gravity spectrum as a function of wavenumber, the mean depth of the interfaces is estimated by the power spectrum analysis. According to the plot of logarithm of the spectral energy against wavenumber, the spectral energy decays as the wavenumber increases. Mainly, this decay process is controlled by the ensemble average depth of the random distribution of sources, which can be predicted by detecting the linear trends of the plot and fitting a linear function to each segment concerning residual or regional anomalies. The mean depth of the interfaces equals the half of the slope of the segments (Spector & Grant (1970)). The reference level (z0) for the Parker-Oldenburg inversion approach and cut-off wavelengths for differentiating the regional complete Bouguer anomaly (high wavelength anomalies corresponding to deep sources), which is utilized for the Moho depth estimation, from the residual one (short wavelength anomalies relating to shallow sources) have been derived from the power spectral analysis results. The density contrast between upper mantle and lower crust was computed from CRUST 1.0 and CRUST 2.0 models.