Moho Depth Estimation in Iran through Geopotential Models and Euler Deconvolution Method
The Moho discontinuity is the boundary between the Earth's crust and the underlying mantle. The Moho depth in different zones of Iran has been estimated by various approaches like analysis of receiver function method according to teleseismic waves recorded in seismic stations; inversion of terrestrial gravity data and using Bouguer gravity anomaly and free air gravity anomaly; spectral correlation analysis of terrain gravity effects; thermal analysis and using geoid height; Parker-Oldenburg method; Least squares Collection. For instance, the first of crustal thickness variations have been computed from Bouguer anomaly modelling by Dehghani & Makris (1984) for the whole Iran. Based on their results, crustal thickness is 55 km beneath the main Zagros thrust, 45–48 km in eastern Iran and 35 km below the Alborz mountains. In this study, a new approach was used to estimate the Moho depth in structural zones of Iran based on geopotential models and 3D Euler Deconvolution method. The Euler Deconvolution method is a semi-automated process and supports the interpretation of magnetic field data, gravimetry data or gravity gradiometry data. It is used to estimate the location of the source of a magnetic or a gravity field anomaly. Euler Deconvolution method is not dependent on an initial depth or density limitations (Reid et al., 1990; Mushayandebvu et al., 2001). Based on Keating (1998) and Silva & Barbosa (2003), this algorithm is proper to determine depth of vertical and horizontal contacts, so it is good to be used in estimating the crust-mantle boundary (Moho depth).
Thompson (1982) showed that Euler's homogeneity relation could be written in the form:
$$(x-x_0)\frac{\partial T}{\partial x} + (y-y_0)\frac{\partial T}{\partial y} +(z-z_0)\frac{\partial T}{\partial z} = N(B-T)$$
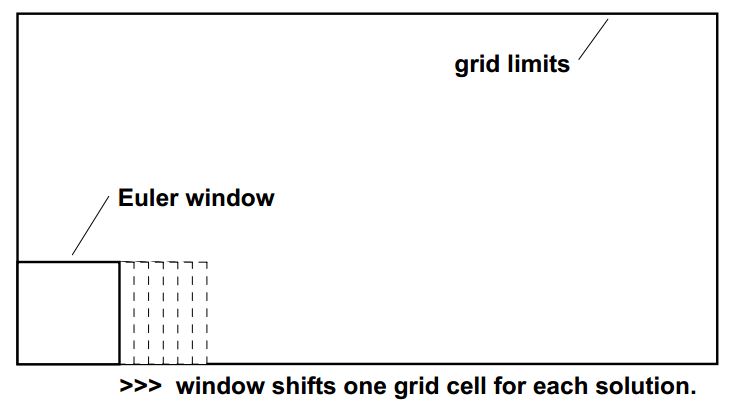
The process is done inside the window and unknown parameters (B, x0, y0, z0) are calculated using least squares adjustment. This window must have two characteristics (Barbosa et al., 1999): 1. It should be large enough to incorporate substantial variation of the field and field gradient.; 2. It should be small enough not to include significant effects from multiple sources.
Mushayandebvu et al. (2004) studied influence of structural index on depth uncertainty and source position using a synthetic anomaly. Their studies show that an estimated depth for an anomaly may considerably change following structural index changes while location (or horizontal) uncertainties (Xoffset, Yoffset) won't change much. Although it is possible to have same anomaly using two structural indices, estimating depth of each structural index will be completely different. Another important parameter is window size which influence estimated depth in each solution. Generally speaking, solutions with much bigger or much smaller depths than window size are not acceptable, in these situations the resulted source cannot fit on geometry of hypothetical model. Reid et al. (1990) studied relation between anomalous depth and window size, they found out that the minimum acceptable depth is equal to window size and its maximum is about three times the window size. Barbosa et al. (2000) showed that it is possible to calculate (x0, y0) parameters (horizontal position of source) through selection of proper window size according to the model with no attention to N. But to calculate depth parameter (z0) which is the most important parameter in interpretation of gravity data, selection of structural index must be done precisely. Window size is a function of model depth and smaller window size provides larger errors for deeper depth because deeper masses have wider anomaly which in order to be included, the window must be wider. In simpler words, small windows deliver proper solutions for shallow anomalies while large windows provide small errors in depth estimation of deep masses.
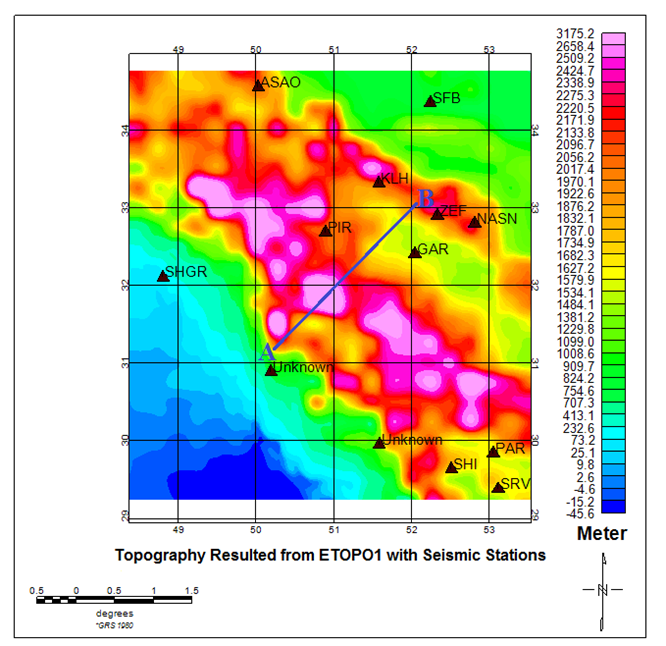
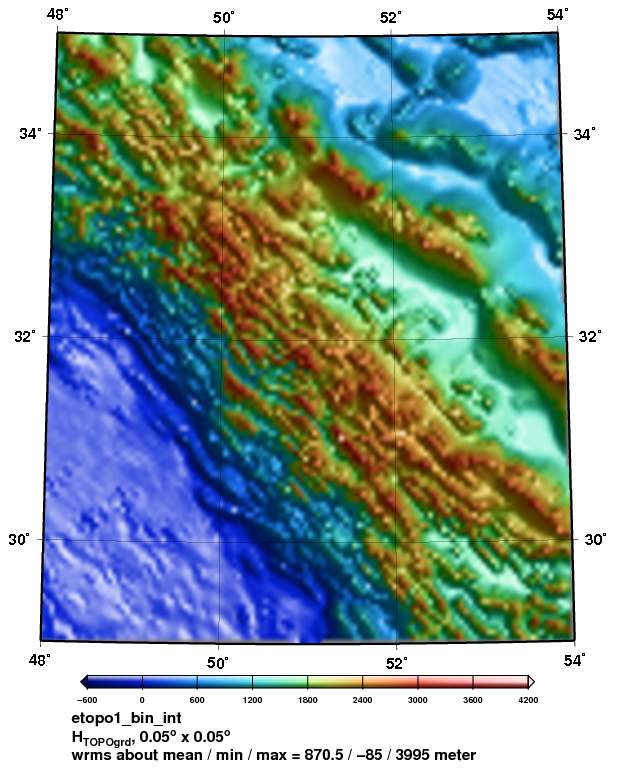
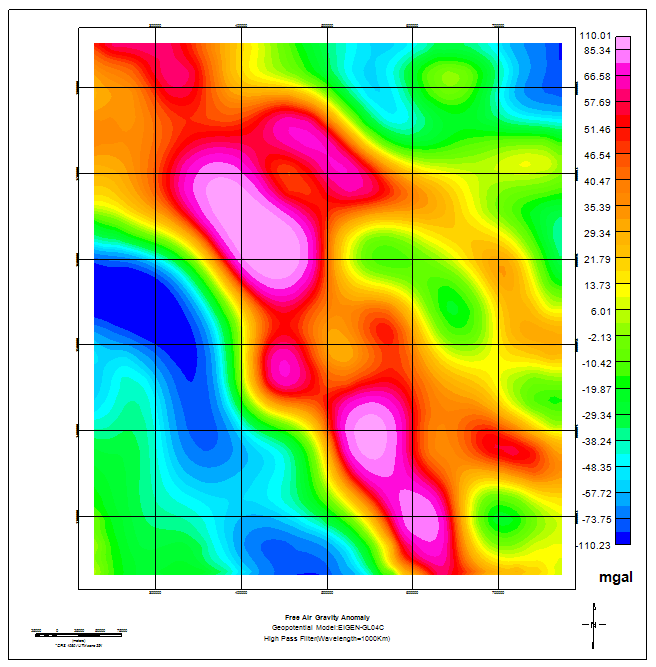
Geopotential models provide homogeneous and uniformly accurate information on the long wavelengths of the earth's gravity field. Since these Models have long wavelengths of gravity field, they are very suitable in determining Moho depth because short and middle wavelengths are not useful in this case. Accuracy of the geopotential models are usually evaluated by comparing the geoidal heights derived from the models with those of the local GPS-Leveling stations. After comparing EIGEN-GL04C model to GPS-Leveling data, it has been chosen as the most accurate model in Iran. In this research, free air gravity anomaly from EIGEN-GL04C model (Up to degree and order of 360; Long wavelengths of gravity field) as the total field (T) and ETOPO1 Model for considering topography effect were used for estimating Moho depth.
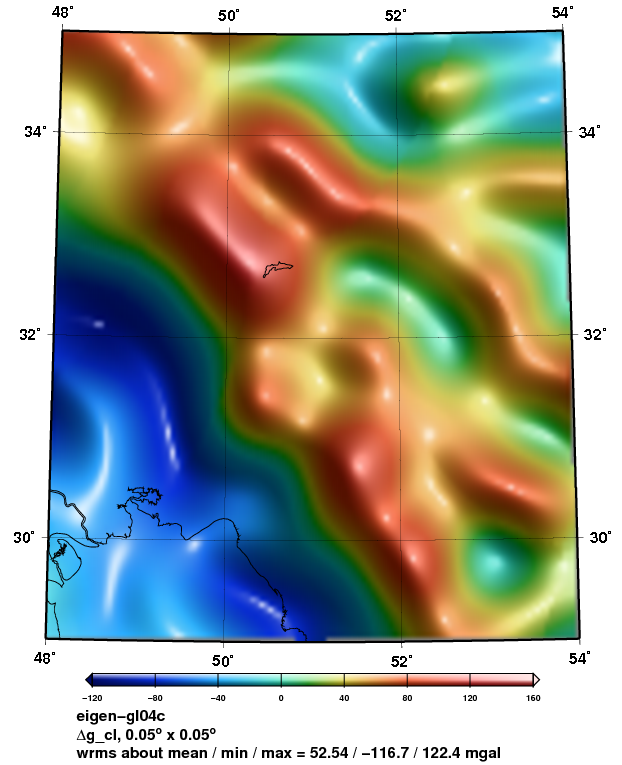
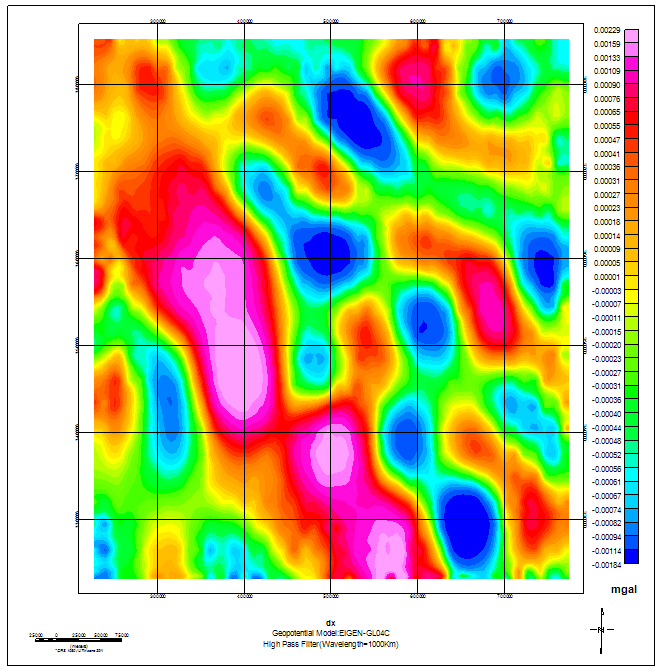
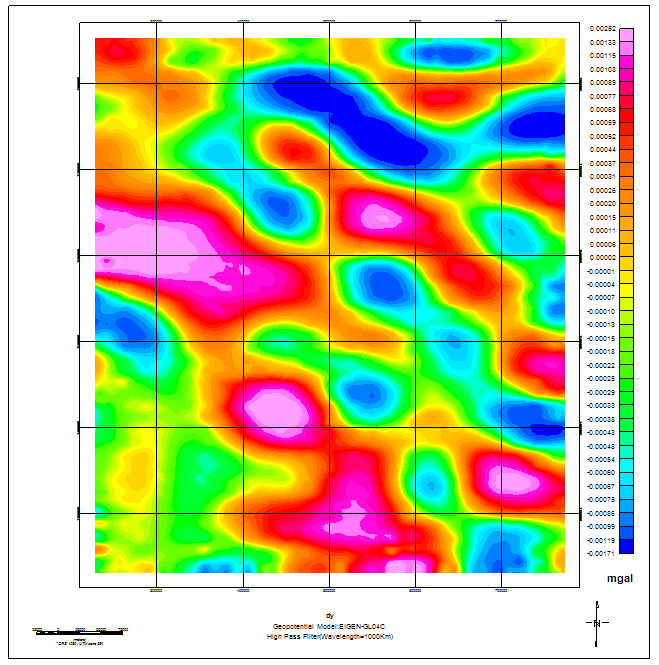
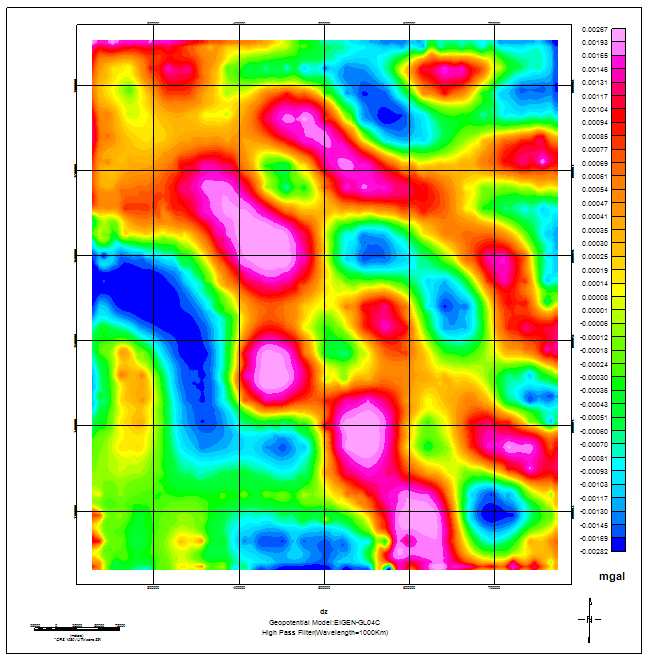
A lot of research has been done about relationship between anomalous depth and spherical harmonic degree. Bowin (1983) showed that second- and third-degree spherical harmonics are related to sources near to mantle-core boundary. Also Hager (1984) showed that fourth- to ninth-degree spherical harmonics are in relation with density models of subducted slab. Although it is not possible to calculate radial distribution of anomalous masses uniquely, but it is known that deeper and bigger sources produce lower degree harmonics of gravity field while higher degree harmonics are produced by shallow and smaller sources (Jackson et al., 1991). According to Bowin et al. (1986) studies, maximum depth of sensitivity for each degree of spherical harmonic is defined as Zmax= rc/(n-1); rc is radius of earth, n is the degree of spherical harmonic and Zmax is the maximum depth of sensitivity; On the other hand λ (Wavelength)=2πrc/n. Since this study aims to find Moho depth (depth of crust-mantle boundary), it can be said the desired depths are below 100 km, so there is a need to use a high pass filter to remove the effect of low frequencies which belong to deep masses, in other words to remove the influence of masses close to the mantle-core boundary and pass high frequencies. In the following figures, free air gravity anomaly and its derivatives in three directions after using a high pass filter with cut-off wavelength of 1000 km are shown. The X and Y derivatives were calculated in the spatial domain using a simple nine-point convolution filter and the Z derivative was computed in the frequency domain using Fast Fourier Transform (FFT).
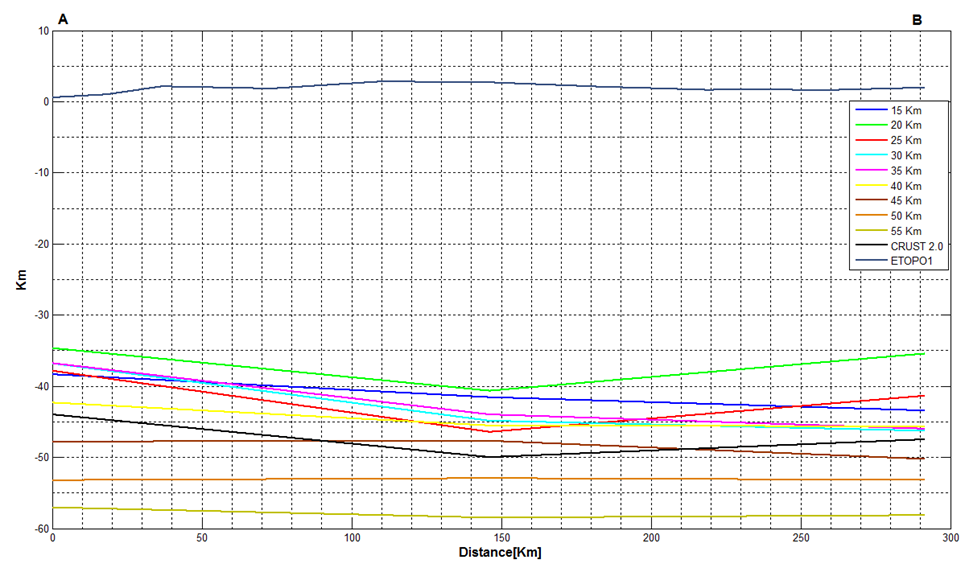
The Moho depth in the Structural Zones of Iran (Zagros Fold & Thrust Belt, Sanandaj-Sirjan Zone, Alborz, Central Domain, Kopeh Dagh) was estimated by Euler Deconvolution method for 15 km to 55 km window sizes and 0 to 2 structural indices. the best window size and structural index in the structural zones were determined by comparing depths from Euler Deconvolution method and those of seismic studies (receiver function method) in 14 seismic stations of the studied region, then the results were compared to CRUST2.0 model and other research works. In the Zagros zone, the results show that for a window size of 40-45 km and structural index of 0.5 the best Moho depth is estimated using Euler Deconvolution algorithm. The following figure shows the results of estimating Moho depth by Euler Deconvolution method for window sizes of 15 km to 55 km and structural index of 0.5 along AB profile in the Zagros zone.